Analytics & Reporting
Unlock the power of your data.
Businesses generate huge amounts of data every day, but often valuable insights remain untapped. We help you get the most out of your data with Power BI. Let your data work for you with our expert support.

Our proven approach
-
Focus
In a first meeting, we jointly determine the scope, functionalities and planning of the Power BI project. We provide the necessary advice in defining the right insights.
-
Building a data model
Next, we analyze the different data sources that are available, build real-time connections and determine the interrelationships in the data model.
-
Visualisation
We focus on user-friendly and intuitive dashboards that clearly indicate at a glance what conclusions you can draw from them.
-
Validation
We check at fixed times whether the dashboard visualizations meet your requirements and whether the underlying data and calculations are correct.
-
Training & Education
In the final phase, we coach the people involved and ensure a smooth handover. This enables you and your employees to work with Power BI yourself and fully utilize the reports.

Why power BI?
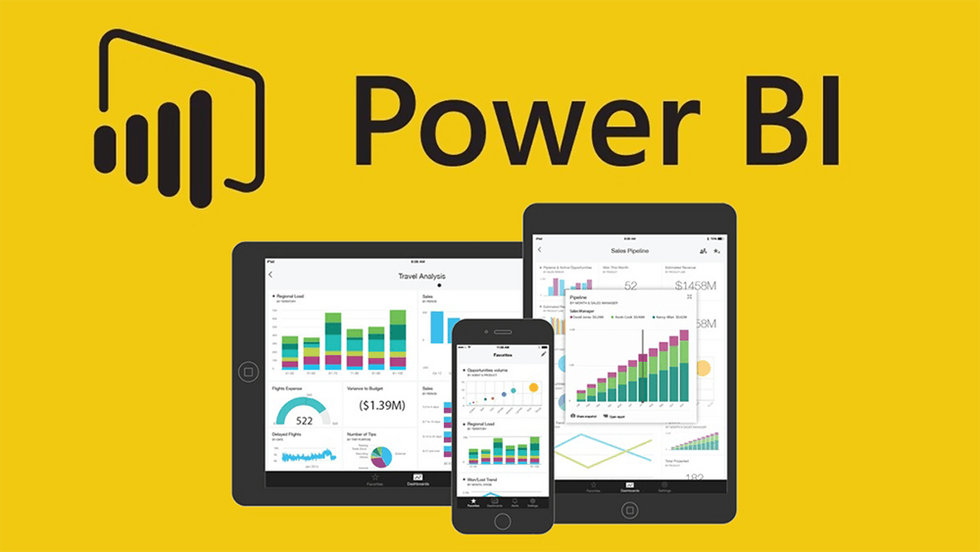
Power BI is a highly accessible Microsoft tool that connects up to hundreds of data sources. Power BI shows you live dashboards and reports based on data from your various IT systems. This makes it possible to display accurate and up-to-date insight into your organization's results: from sales and marketing across operations to finance.

"At Consultes, we were looking for clear, automated financial reports. Thanks to horsum's Power BI solution, we now have a clear overall picture, visually easy to read for financial laymen. The cooperation was structured, expert with the necessary added value and proactive. We now use the reports regularly for follow-up and monthly executive reports, which has given us valuable insights and easier data sharing with employees."

Project in the spotlight:
Consultes and horsum: Together towards efficiency in financial reporting.
Consultes is all about efficiency, whether it's improving environmental performance or optimizing business processes, such as financial reporting. When we ran into challenges with our reporting, we called on horsum to support us. This collaboration has since provided great added value within our company. CEO Pascal Herman is happy to share his experiences.

Why Microsoft Power BI as a BI tool?
Power BI vs. Qlik vs. Tableau
You have undoubtedly heard about Microsoft Power BI. But other BI tools such as Tableau and Qlik may also ring a bell. But exactly which BI tool is the best option for your business?
Ready for the next step?
We are happy to come by for an introductory meeting to turn your business goals into concrete actions.


