- Power BI
- Analytics & Reporting
5 Common mistakes in data analysis and how Power BI solves them
Data analysis is an essential part of strategic decision-making. Yet many companies' current reporting process creates inaccuracies in the data and limited usability of the insights it brings.
Here are 5 common mistakes and Power BI's solution to them.
1. Multiple versions of the truth
Many organizations work with multiple Excels or data models, set up and managed by different people. The setup is often not fully transparent or documented. This leads to questions such as:
- Where does all the data come from?
- What data are all in there? What has been filtered out?
- What manual manipulations have been made to the data?
- How exactly are the KPIs calculated?
- ...
Especially in the case of Excel reports, employees still like to manage their own ‘Excelleke’ with certain changes. Soon different versions of one file are created, making it unclear which is now the ‘correct’ version. The differences between these versions complicates decision-making and reduces the reliability of analyses.
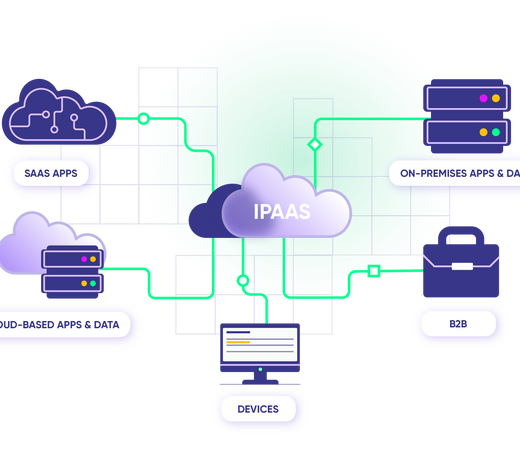
Through Power BI reporting, you easily create this version of the truth. You centralize different tables from different sources (ERP, CRM, accounting, etc.) in one place, clean up the data, and use this data as the source for all reporting.
Result: clarity and consistency the data.
In the data model, you bring this data together. You establish the logical relationships between the tables and make the calculations. You use the future-proof model for the various reports.
Result: clarity about and consistency of the data and calculations.
2. Little to no security
Data must be properly secured, especially with sensitive information. Are you sure that persons who should not see the data or report cannot see it?
Through the Power BI application, you easily determine who is allowed to see which reports. In addition, with Row-Level Security (RLS) you ensure that users only see the data for which they are authorized. Each representative only his own customers? The team manager only the employees from his or her team? No problem at all!
3. No real-time insights
Static reports provide outdated insights, preventing organizations from responding quickly enough to changing situations. This leads to missed opportunities or wrong strategic choices. In addition, it also keeps you away from other tasks. Indeed, creating or updating reports is too often still a time-consuming task.
This does not apply to Power BI reporting. Once your report is set up, you always have access to the latest data thanks to automatic updates. In addition, Power BI also supports real-time data streaming, so analyses are always based on the most current data for up-to-date decisions.
4. Poor data quality
Organizations still underestimate the importance of data quality. Incomplete, incorrect or outdated data lead to inaccurate reports and, consequently, wrong decisions.
During the reporting setup, Power BI offers several tools to clean up your data. This data cleaning is a crucial first step in the setup. Because you then make this data available centrally, you don't have to do this over and over again. You always reuse the cleaned data.
It is also interesting to expand your reporting with control reports (e.g. all customers without a VAT number). This gives you an overview of the inconsistent data at all times and clarifies which corrections need to be made in the source system.
5. Lack of actionable insights from big data
Many companies have access to huge amounts of data, but struggle to turn this data into actionable insights. Reporting is fragmented into different files and often overloaded with too much detail, making it difficult to quickly identify key trends and KPIs.
Power BI centralizes reporting in one place. It brings together data from different systems into one or more reports, and makes them available in one central location for end users. You arrive at actionable insights through:
- Using interactive visualizations and intuitive filters to analyze the completeness of data, or just a specific subset.
- Tenavigating from high-level dashboards to detail pages. You start with high-level KPIs and trends, then move into more detail via drill-throughs or drill-downs.
- Through the ever-expanding AI functionalities. With tools like Quick Insights, Key Influencers and Decomposition Trees, you can easily identify key trends and factors.
Ready to make data-driven decisions?
Conclusion:
Common mistakes such as multiple versions of the truth, poor security, lack of real-time insights, low data quality and an abundance of data without actionable insights limit organizations in their decision-making. Power BI solves these problems by centralizing, securing and transforming data into actionable insights.

